Global Prime uses the world’s fastest non-bank market makers who specialise in Indices and Commodities trading to give you the tightest prices and best execution.
Not ready? Try a Free Demo Account


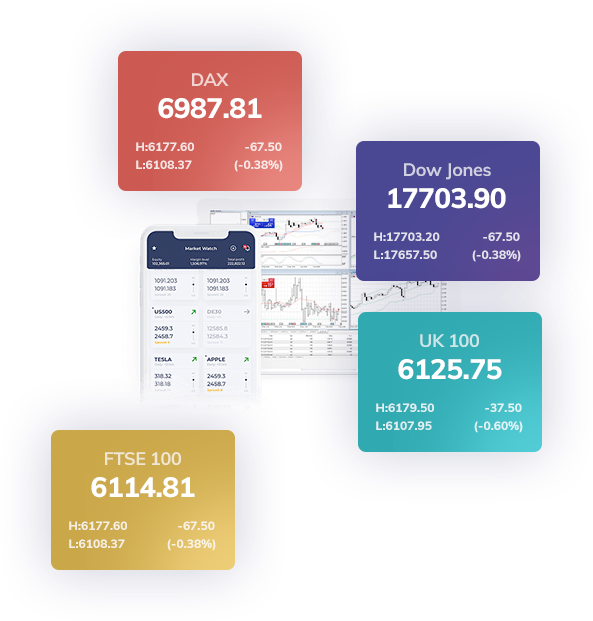
If you’re after tight spreads and great execution then you’ll love our Index CFD offering. We use specialist non-bank market makers to derive a fast and sharp price across our range of Index CFDs. You’ll frequently see one of the tightest spreads in the world on the Dax and Dow, two of the most popular indices for CFD traders.
You’ll be able to verify our performance with trade receipts that show the bank who filled your trade, execution speed, slippage and more.

Trade indices as leveraged CFDs with tight spreads. Access popular indices: S&P 500, GER30, UK100 +more.
| Low cost trading |  |
| Get exposure to an entire market sector at once | |
| Trade Indices 24/5 | |
| Hedge against a drop in the value of your shares portfolio | |
| Speculate on a group of shares for less than the cost of trading them individually | |
Commission FreeOur new lowest fee model. Trade EURUSD from 0.4 pips round turn with no added commissions Apply Now | Spreads + CommissionTraditional ECN fee model with spreads from 0.0 pips and $7/lot commission. Apply Now | |
|---|---|---|
| Spread From | 0.4 Pips | 0.0 Pips |
| Commission | $0 | $7 per round turn lot |
| Starting Deposit | $200 | $200 |
| Platforms | MT4, TraderEvolution, TradingView | MT4, TraderEvolution, TradingView |
| Server Location | New York | New York |
| Execution speeds from | 1ms | 1ms |
| Micro lot trading(0.01) | | |
| 100+ Markets | 100+ Markets FX, Indices, Commodities, Digital Currencies, Shares, Bonds | 100+ Markets FX, Indices, Commodities, Digital Currencies, Shares, Bonds |
| One Click Trading | | |
| Trading Styles Allowed | All | All |
| Order Distance Restriction | None | None |
| Suitable For | All Traders | All Traders |
Our Indices CFDs allow you to take a view on the world’s largest and most important global stock markets without trading or owning the underlying shares. Indices such as the DJIA index (US30) represent a basket of the 30 largest companies listed on US stock exchanges. These Indices can be bought or sold using a CFD with the aim of generating a profit.
Most traders will know the value of the S&P500 and DJIA in order to understand the current market sentiment/regime/theme, e.g. risk on or risk off, bullish or bearish, am I a buyer or seller. Even if you’re not an Index trader, these are markets that you’ll want to keep an eye on.
The gross profit on your trade is calculated as follows:

5 contracts NAS100 x 7,798.20 = 38,991 USD
5 contracts NAS100 x 7,990.30 = 39,951.50 USD
$960.50 USD
The price of the NASDAQ100 is 7,798.20 bid /7,799.80 ask. You would like to buy 5 contracts at 7,798.20 ask. (1 lot = 1 contract)
Two days later, the NASDAQ100 has increased to 7,990.30. Since you are in profit, you would like to close your position by selling 5 contracts.
View our trading conditions across our full range of products to see how trading with Global Prime is your next best move.
Check our Market hours for open/trading hours across all of our products.
Trade FX, Metals, Commodities, Indices, Digital Currencies, Bonds & Shares.
ECN | STP | NDD. Providing market leading pricing and execution is our #1 purpose.
Trade with confidence knowing that you're getting
spreads from 0.0 Pips.
Modest leverage gives traders the best chance of successful trading the markets.
Deposit funds in 6 base currencies: USD, AUD, GBP, EUR, CAD & SGD. Multiple Options.
Margin Call @ 120% margin Level. Margin Stop Out @ 100% margin Level.
Trade from 0.01 Lots.
$0.10/point on Indices & 10c/point on FX + Metals.
Trade up to 1000 Lots.
Scalper, HFT, news trader and EA friendly.
Open a trading account from A$ 200 or equivalent in supported currencies.
Individual, Joint, Corporate and Trust ECN trading accounts available.
Trade in AUD, USD, EUR, GBP, SGD or CAD.
Your choice!
$7 USD/lot
or Trade Commission Free.
Save on your trading costs.
CFDs are filled by our non-bank market makers who specialise in Indices and Commodities trading to ensure the tightest prices and best execution.
From the above example, let us assume that the ex-dividend date for NAS100 Index is on the 15th May 2019. The owner of the CFD must have an open position for Index NAS100 before the 15th May 2019 and it must remain open until the 15th May 2019 in order to receive the dividend.
The owner (long position) of the CFD will receive the dividend while a seller (short position) will pay the dividend.
Index CFDs are cash instruments and subject to daily rollover fees. 3 day CFD financing is applied to open positions on Friday to cover the weekend (as opposed to 3 day FX swaps applied on Wednesday rollover).
Our CFD prices come from our stack of non-bank market makers who derive prices by way of a fair value estimate of the price in the underlying market (futures, indices, stocks etc) whilst accounting for factors such as their exposure and hedging requirements.
Indices are a measurement of the price performance of a basket of stocks from an exchange. For instance, the AUS200 follows the 200 largest companies on the Australian Stock Exchange and the US500 that tracks the largest 500 companies by market cap on the following exchanges; NYSE, NASDAQ, CBOE. Our indices CFDs are derivative securities that track the underlying markets as well as the pricing from our CFD providers and enable clients to speculate on price movements without having to actually own the actual futures product.
CFD trading is extremely risky. As you are trading a leveraged product, you will have the ability to open positions that are far larger than your account balance. Accordingly, it is possible to lose more than your account balance.
We offer competitive leverage rates which are determined by the Global Prime entity you register with. See our leverage here https://www.globalprime.com/trading-conditions/margin-leverage/#leverage.
Market conditions will vary outside of market hours and the spreads on these products will be wider. The underlying market that Indices CFDs are based on can be closed or less liquid. CFD providers are able to offer a fair value estimate of where the futures market would be, enabling 24h pricing. Please be wary of this and ensure that you are aware of the increased volatility present outside of market hours.
Positions held overnight (17:00 ET/EDT) will be charged or paid a swap/financing fee.
1000 lots
0.10 lots except for US500, JPN 225 and HK50, these have a 1 lot minimum.
The market hours for indices follows the underlying market from which they are based. For instance, US500 will follow the NYSE market hours whereas the ASX will follow the Australian market hours. For more information https://www.globalprime.com/trading-conditions/market-hours/
One index point is = to 1 unit of base currency. For instance, one index point of the UK100 is = to 1 GBP whereas 1 index point of the NAS100 is = to 1 USD.
Global Prime has some of the tightest CFD spreads in the world. The average spread on indices can be found at the following link: https://www.globalprime.com/trading-conditions/spreads/
Yes, dividend payments are adjusted after the fact and are either charged or credited to your account depending on your position - usually on the day following the ex-dividend date.
In essence, indices are the measure of corporate performance or an overall economy. Indices trading - also known as “market-based trading” is a way to trade indices by buying stocks from one index and selling it against another index in order to profit from the relationship between them.
Index trading is when you buy and sell an index. Investors will bet on the price going up or down. If it goes up, they'll buy; if it goes down, they'll sell. You won't buy any stocks, but you will be buying the average of all of them instead. When some go up, the index goes up. When others go down, the index goes down.
You can trade indices in three different ways – futures, options and CFDs. A future is like an agreement to buy or sell at a certain price on a specific date in the future; an option gives you the right to choose between buying (a call) or selling (a put) at a specific price on the same date. A CFD (Contract for difference) is like a future, except you don't have to own anything until you close your position, at which point, if you make money, you get paid. You can also use spreads and combinations of all of those things to generate returns from indices.
When you trade indices online, there are two main types: index cash CFDs and index futures CFDs. The main difference between the ‘cash’ market and ‘futures’ market is that the ‘cash’ does not have an expiry date. The ‘futures’ market, however, has an expiry date, normally known as a ‘rollover’.
A futures contract is effectively an agreement between the buyer and the seller on the price that has to be paid by the buyer at a given future date.
There are many indices, but traders typically focus on the largest and most globalised ones. Many of them include blue-chip stocks. Blue-chip can be defined as a well-established company with a market cap in the billions and considered a market leader. Some of the largest indices traders focus on are:
The movement of index prices is primarily dependent on external forces. The price will generally decrease in times of uncertainty that bring weakness to the relevant country's economy.
Some factors that can impact the price of an index include:
There are several reasons that stock indexes have been popular amongst beginner traders and experienced investors for many years.
As an investor, you can own a little of almost anything. For instance, if you wanted to have exposure in the oil and gas sector but don’t want 70% of your portfolio to be tied up in one company, then you could purchase an index ETF that tracks this sector.
A wide variety of professional traders (money managers) use indexes for their value. These professionals study and analyse the markets using these tools to determine where they should place trades.
The information we get from indexes is often much more accurate than individual company reports or economic indicators, because an index represents a basket of various stocks within an industry or country. For example, if you wanted to know how the stock market is doing overall, you would not just look at manufacturer XYZ’s report and assume the stock market has done well; you would instead want to take a look at an index that includes all of the performing companies on the stock exchange.
This may seem like a minor point, but if one of your investments tanks and ends up losing a substantial amount of money for you, the impact on your overall investment portfolio is much less than losing all of one stock in an index.
From a trading perspective, indexes are easy to trade because they are liquid and have constant volume. This allows traders to get into and out of trades quickly without having to worry about their order getting chopped or taken out at a bad price.
Since indices represent an entire sector of the market, it allows investors to gain exposure to various industries without having to do a lot of research and analysis on individual company stocks.
There are also some risks involved with trading indices, but in the most part they can be managed by being aware of them and taking the appropriate action to manage those risks.
The biggest complaint about trading an index is that if one company goes bankrupt or encounters a major problem that threatens its ability to continue as a going concern, you will feel the full force of this problem. This means that if a company that represents 5% of the index goes bankrupt, it is as though you have lost 5% of your investment.
Some would argue that when you invest in an individual stock, you are exposed to the same risk of loss -- but there is one major difference: A single company’s failure will not have a drastic effect on an individual stock’s performance, but when one company in the index goes bankrupt, investor sentiment tends to spread to other companies in the index and it can cause major losses.
The other main concern with indices trading is that some are expensive to trade because of their popularity. For example, if you were to go online and try to purchase an individual stock (instead of buying an index), there is a good chance that this stock will be listed on several different websites, with varying prices. This makes it easy for you as the investor to buy at the lowest price available.
Conversely, when trading an index, other traders are also going through the same process of buying and selling this same index -- and the result is that price may be slightly higher than what it would be if you were to trade an individual stock.
The solution to this problem is twofold: One, check for liquidity; some popular indices have a lot of trading volume (liquidity) which will keep the spread tight between bid and ask prices.
And two, take the time to find out if there are any hidden charges involved with this particular index.
Now that you have a better understanding of Indices Trading - consider Global Prime for your next trade.

See the performance of every trade execution including the liquidity provider behind your trade.
MT4, TraderEvolution and TradingView. Fully supported.
Spreads From
Execution From
Trade Markets
Deposit & Withdrawal
Fund your account with over 15+ instant deposit methods. AUD, EUR, GBP, JPY, SGD or USD - save on conversions!

Trade directly from charts using your TraderEvolution account - easy!
